Volume Profile Basics
What the session volume profile shows
A session volume profile displays traded volume by price instead of by time. A regular volume bar tells you how much volume traded during one candle. A volume profile tells you where that volume traded on the price ladder. This makes it useful for futures, stocks, ETFs, forex-related products, and other markets where traders want to identify high-activity price zones.
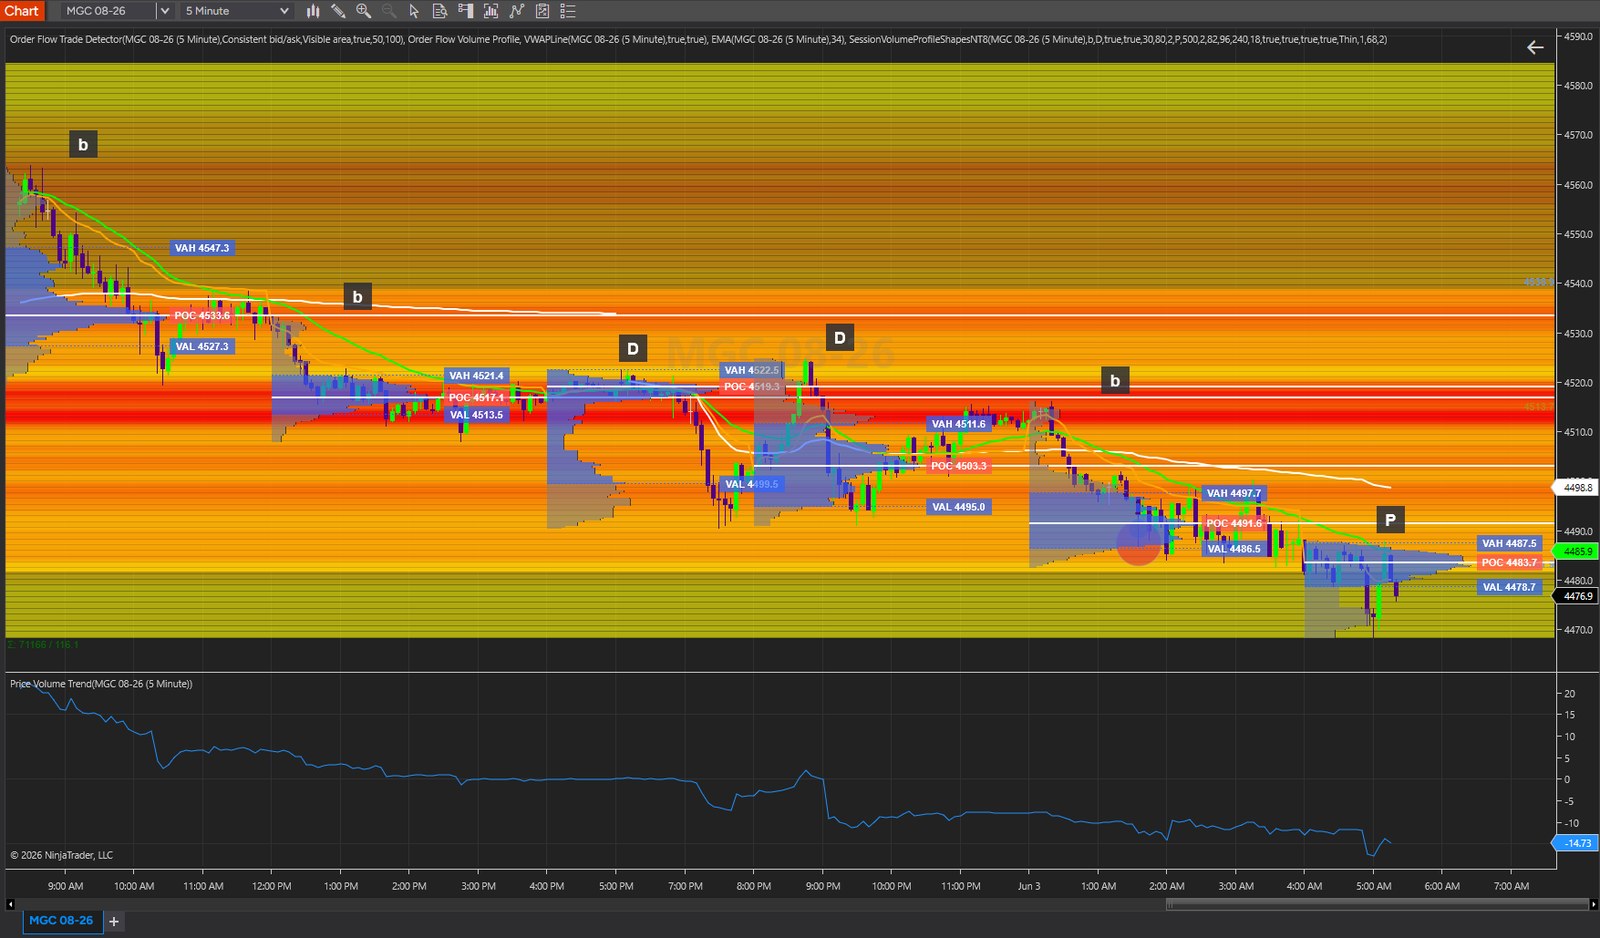
POC — Point of Control
The POC is the price level with the highest traded volume in the selected session. It often represents the fairest price accepted by both buyers and sellers during that period. Traders watch it because price may rotate back to it, reject from it, or use it as a reference when the next session opens.
Value Area — VAH and VAL
The value area is the range where most of the session volume traded, commonly around 70% depending on the platform setting. VAH means Value Area High, and VAL means Value Area Low. These levels help mark the session’s accepted trading range.
High Volume Nodes
High volume nodes are thicker areas of the profile. They show prices where the market spent more activity and where two-sided trade was accepted. These zones can act like magnets during rotational sessions.
Low Volume Nodes
Low volume nodes are thinner areas of the profile. They show prices where the market traded quickly or found less acceptance. These zones can behave like rejection areas or fast-travel zones when price moves through them.
Profile Shapes
Reading b, P, and D shapes
b-shaped profile
A b-shaped profile often appears after a downside move or bearish session. The profile is usually heavier near the lower prices, with thinner trade above. This can suggest selling pressure, long liquidation, or lower-price acceptance. It does not automatically mean short, but it warns that sellers controlled much of the auction.
P-shaped profile
A P-shaped profile often appears after an upside move or bullish session. The profile is usually heavier near the upper prices, with thinner trade below. This can suggest short covering, upside pressure, or higher-price acceptance. It becomes more useful when confirmed by price holding above prior value or rejecting lower prices.
D-shaped profile
A D-shaped profile is a more balanced distribution. Volume builds near the middle, and price tends to rotate around the POC. This shape often points to a balanced or range-bound session where buyers and sellers are accepting a similar fair-value zone.
Practical Use
How traders use the session profile
- Support and resistance: Prior VAH, VAL, POC, high volume nodes, and low volume nodes can become reference areas for intraday decisions.
- Acceptance versus rejection: If price enters a prior value area and stays there, the market may be accepting that range again. If price quickly rejects it, that level may act as resistance or support.
- Trend versus balance: A directional session often leaves a stretched or uneven profile. A balanced session usually builds a wider middle area and rotates around the POC.
- Context with other tools: Volume profile is stronger when combined with VWAP, session highs/lows, opening range, liquidity zones, options open interest, GEX levels, and risk management.
Important trading interpretation
A volume profile level is not a buy or sell signal by itself. It is a map of where the market previously accepted or rejected price. The better use is to build a trading plan: identify the key levels first, then wait for price behavior, volume, order flow, or candle structure to confirm whether the market is accepting or rejecting those levels.